
The biggest stats lesson of 2016

what is the big statistical lesson of 2016? Here at STATS.org, we believe 2016’s major message is that statistical issues should be reported clearly and frequently to avoid miscommunication to lay audiences. This message was highlighted by the mismatch between the 2016 presidential election predictions and outcome.
What if you flip a coin twice, and both times it lands on “heads.” Does the coin seem rigged? The chance of two heads over two coin flips is 25 percent—less than the 29 percent chance that ESPN’s FiveThirtyEight gave Donald Trump for winning the presidency [1]. Although this probability was smaller than the 71 percent probability assigned to a Hillary Clinton win based on the final FiveThirtyEight pre-election forecast, the Trump win wasn’t as shocking an outcome as some journalists reported.
Many previous articles have already covered “what went wrong” in forecasting the election [2-4], but how did the media do in covering this “wrongness” from a statistical perspective? We discuss three quantitative issues relevant to the 2016 election predictions and examples from major news outlets where the reporting on these issues was done well.
Errors in sampling and polling
Why it matters
In the simplest case, a poll might randomly sample likely voters to get a sample that is representative of the whole voting population; however, a sample may include fewer people from one specific group, such as non-college educated voters, than one would expect. This imbalance may be due to random chance, non-response, or other factors; but the result is that this sample is no longer representative of the whole voting population. Individuals in undersampled groups should, therefore, be counted more by increasing their “weight” in the final polling prediction to reflect the voting population.
Selecting the “right” weight to give to a specific group is challenging, but vital to accurate polling prediction. Weights are determined based on pollsters’ understanding of what the final voter population will look like with respect to race, education, income, and other factors. For example, if a poll only includes 5% African Americans, but they make up 12% of eligible voters [5], the pollsters might adjust their analysis to give more weight to the opinions of African Americans in the sample. The selected weight will depend on the pollster’s prediction of how many eligible African American voters will vote on Election Day. Errors in the sampling or weighting schemes can lead to statistical bias—the difference between the polling prediction and the final outcome.
Reporting on error
Biases in sampling and polling may have been the most covered aspect of the 2016 election predictions. Because the polling data differed from the election results, many articles tried to explain why. Some articles went further and described (1) why obtaining good samples can be difficult and (2) why some assumptions made by pollsters could have impacted the outcome.
The Huffington Post described in detail many of the sampling issues related to the 2016 election predictions [6]. Specifically, they noted that determining weights for polling is challenging because before the election, we can only guess who will end up voting—in other words, the population of 2016 voters did not exist before they actually voted in the election.
Many news outlets covered the L.A. Times/USC poll that predicted a Trump win when many other polls did not. These articles noted that this poll may have produced a better estimate of the 2016 voting population by asking individual respondents to rate their own likelihood of voting instead of relying solely on their past voting history [2,7-9]. As USA Today put it, by eliminating individuals who did not vote in 2012, other polls may have underestimated Trump support [2]. This methodology allowed the L.A. Times/USC poll, said Fox News [8], to “detect white voters who sat out the 2012 election, but broke for Trump on Election Day.”
However, it is worth noting that there was some criticism of the L.A. Times/USC poll for weighting respondents based on whether or not they voted in 2012, and, if they voted, for whom. Self-reported voting behavior may not be reliable because of errors in recall or because individuals may not admit they voted for the losing candidate [10]. This poll was also criticized for giving large weights to small demographic groups (e.g. young African American voters) who were not well represented in the poll [11]. Identifying the attributes of each poll that are, or that will be, informative for prediction is challenging, but will be important for future election predictions. Notably, the fact that this polling analysis provided a comparatively higher percentage chance that Trump would win in 2016 does not mean that it will out-perform other polls in 2020.
Uncertainty
Why it matters
Uncertainty helps to quantify the range of possible outcomes for an event, such as the 2016 election. Uncertainty is present in individual polls as well as in election forecasts that aggregate multiple polls together. As a simplification, suppose the only candidates were Trump and Clinton. Prior to the election, FiveThirtyEight had Clinton with 52 percent of the two-party vote (considering only Trump and Clinton as possible candidates) [1]. If the true outcome had been 51.5 percent or 52.3 percent, would that have been surprising? What if the true outcome had been 45 percent?
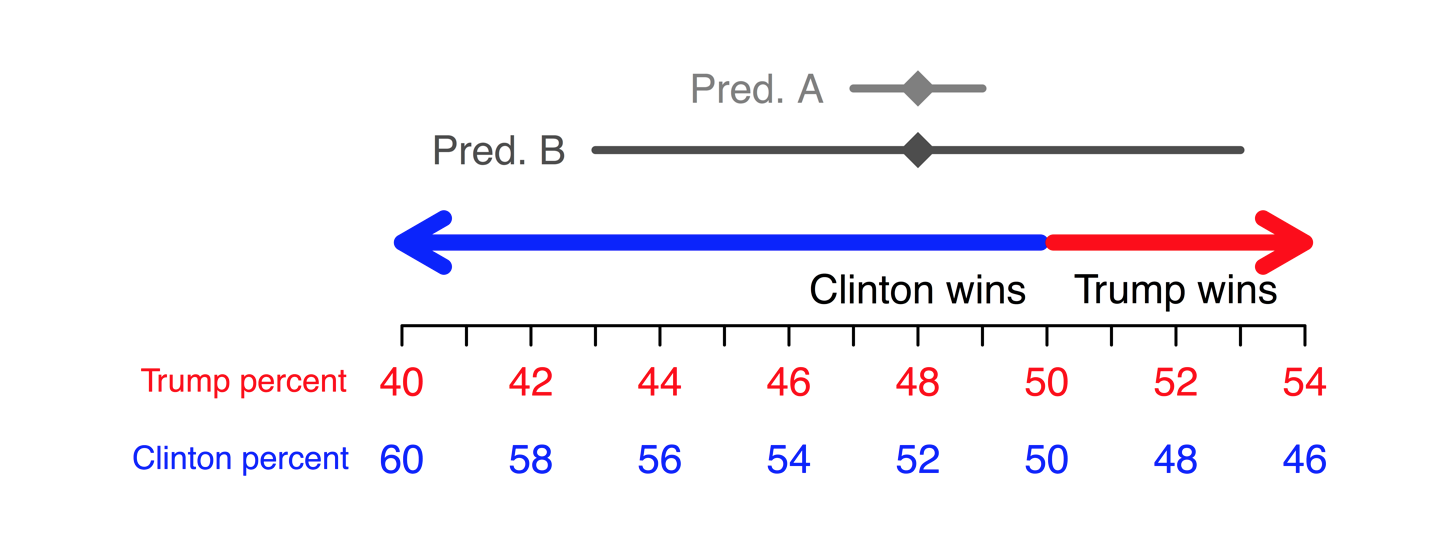
Suppose we had two predictions, both with Clinton at 52 percent of the two-party vote. Prediction A gives a range of likely outcomes between 51—53 percent* and prediction B has a greater uncertainty with a range from 47—57 percent. In prediction A, a Clinton loss would be fairly surprising since all values in the range correspond to a Clinton win. In prediction B, a Clinton loss, characterized by the values below 50 percent in the range, would not be as surprising. This is shown in the figure below, where prediction A’s range falls completely on the “Clinton wins” side, while prediction B is spread over both sides. The uncertainty describes quantitatively how confident we are in the prediction of 52 percent.
Example uncertainty intervals for the share of the two-party vote
The most widely reported election statistics were not percentages of the vote, but the percentage probability that a candidate would win. Assuming a simplification with no Electoral College, these probabilities are roughly the proportion of the prediction range (e.g. predictions A and B above) that corresponds to a candidate winning. The larger percentages correspond to more certainty, or more of the range falling to one candidate, while lower percentages correspond to higher uncertainty. In their final models, FiveThirtyEight had the probability of a Clinton win at 71 percent, which corresponded to a higher uncertainty than most forecasts, while the Huffington Post had Clinton at 98 percent.
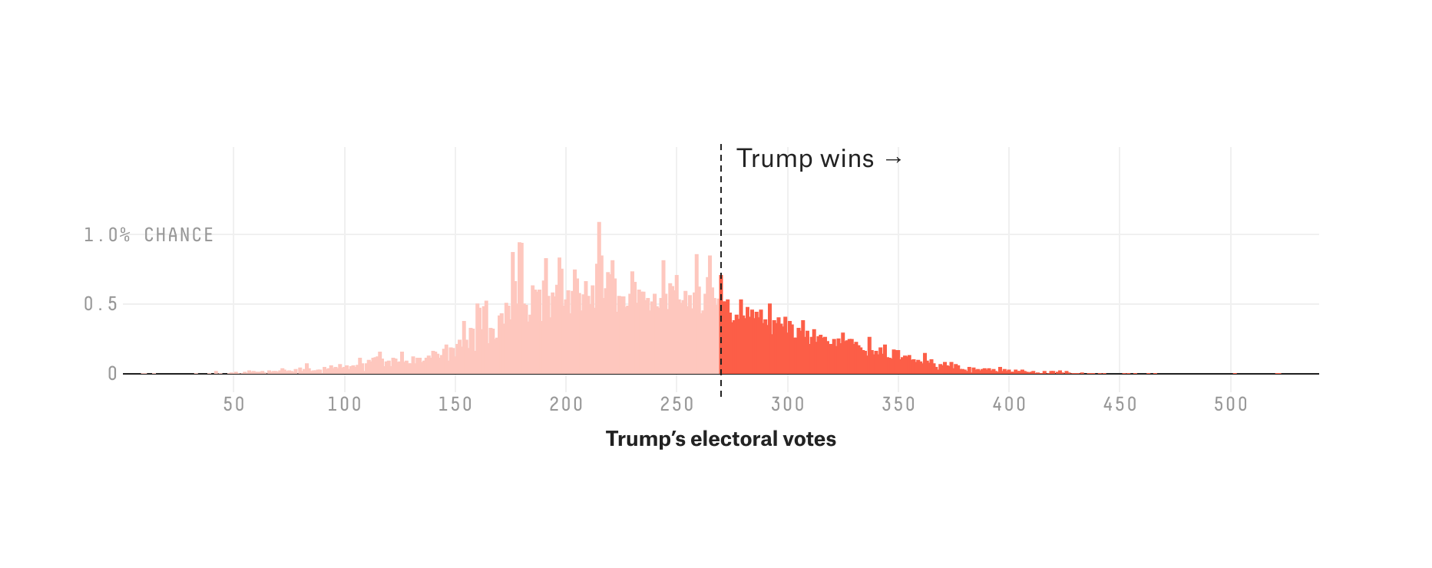
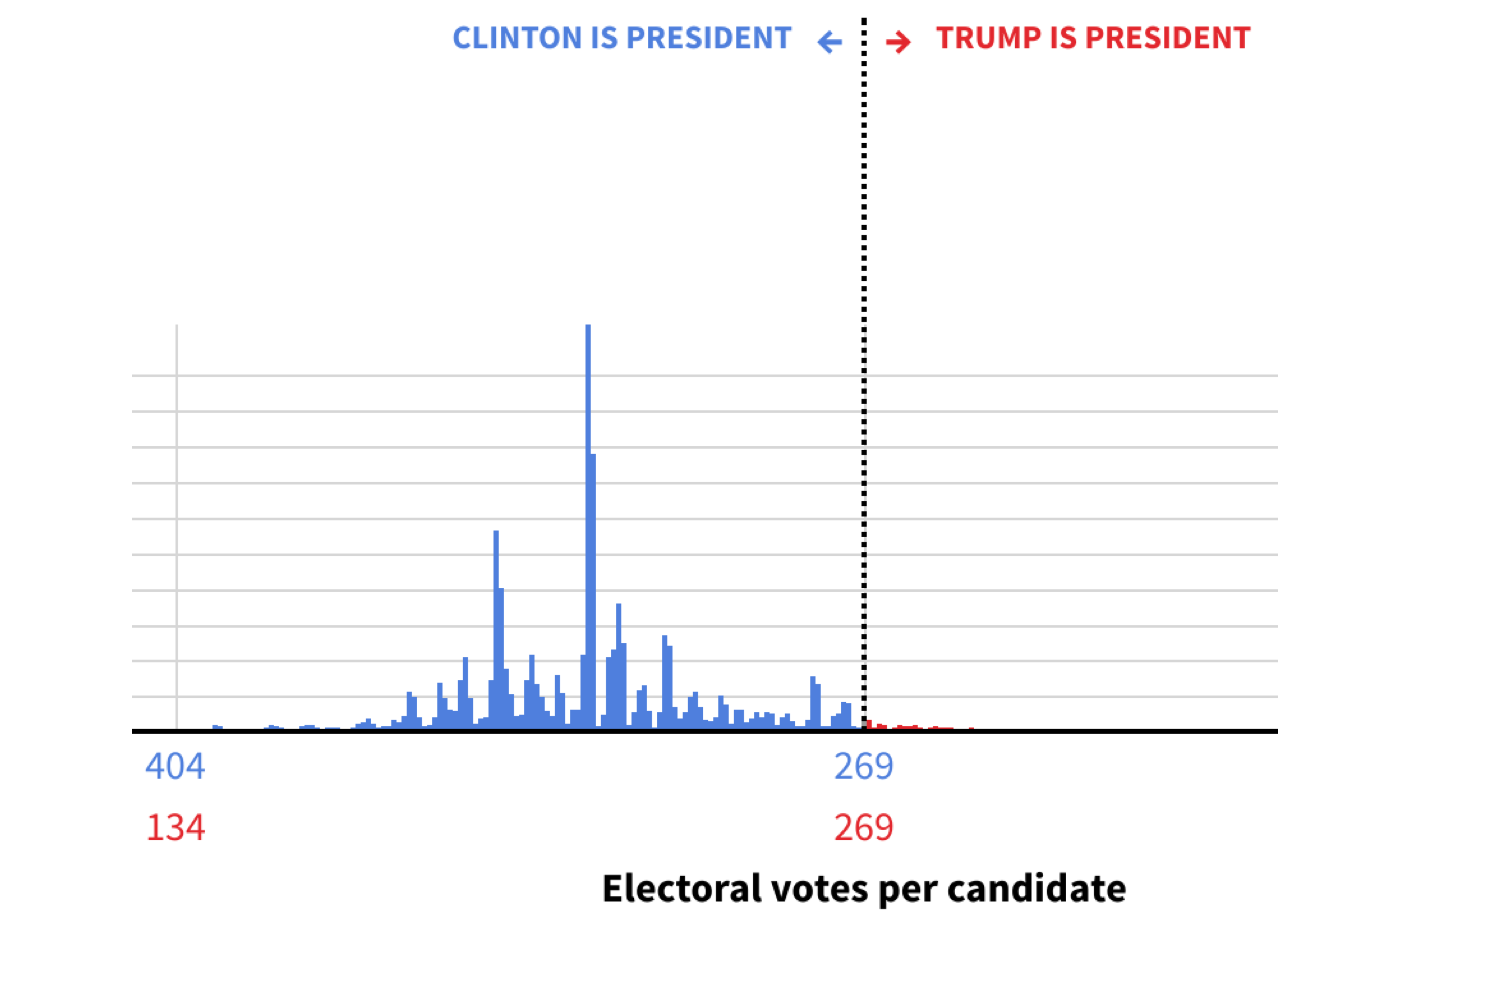
For their final Electoral College predictions, both FiveThirtyEight [1] and the Huffington Post [12] displayed uncertainty using histograms, a visualization technique to show how likely different outcomes of the Electoral College would be. For each possible number of electoral votes in support of Trump (on the horizontal axis), the news organizations estimated the probability of occurrence (on the vertical axis). Below, we reproduced two figures from FiveThirtyEight [1] and the Huffington Post [12], respectively. More uncertainty can be seen in the FiveThirtyEight forecast figure, where the bars are spread wide across the horizontal axis, including some bars to the right of the “Trump wins” line. The Huffington Post forecast had less uncertainty, which can be seen in the second figure below with a more “peaked” histogram with values less dispersed compared with FiveThirtyEight’s.
FiveThirtyEight final election prediction, reproduced from [1]
Huffington Post final election prediction, reproduced from [12]
Each election poll had some uncertainty associated with it, which was driven by sampling variability, and likely other, possibly unknown, factors. When polls are combined to create election forecasts, standard approaches weight some polls more than others based on this uncertainty. In this way, polls that have less certainty, possibly because they reached fewer people, can be given less weight in the final estimate. Differences between election forecasts are partially caused by differences in how polls are weighted and uncertainty is incorporated.
Reporting on uncertainty
Describing uncertainty is an important, if challenging, task for the news media. After the election, the Huffington Post and the New York Times both noted that, though the polling and prediction methodologies were generally sound, the election forecasts often did not do a good job explaining the margins of error* associated with the predictions [6, 13]. While many articles may have mentioned the margin of error using some standard language [6], this may not have been enough to explain the implications of this uncertainty. When margins of error are not sufficiently explained, this can lead readers to think that the prediction is certain to occur.
Other articles also pointed out that, prior to the election, Americans did not understand how to interpret a 29 percent probability—the FiveThirtyEight prediction of a Donald Trump win. As we mentioned earlier, this probability is slightly higher than the chance of two heads in two coin flips. The Chicago Tribune said that people failing to understand uncertainty is what led to the general sense of surprise following the election [14]. The Washington Post quoted Ronald Wasserstein, the executive director of the American Statistical Association (a partner of STATS.org), saying, “we have a tendency to think that if there’s only a 30 percent chance of rain and it rains, that the forecast was wrong. And that’s just not the case” [15].
In an article preceding the election, the Huffington Post described polling uncertainty as “how much the numbers might change due to the random chance of who is selected to participate in the poll” [16]. This article did a good job of explaining that we could have seen a Trump win just by chance alone. They describe how various sources of error—not limited to sampling error but also polling error—contribute to the overall margin of error. The author also discusses the difficulty in reporting margins of error provided by pollsters because these estimates may not account for all types of error present within a polling prediction. Because of these issues, reporting on forecasts such as FiveThirtyEight’s that incorporate multiple sources of uncertainty across many polls might be more useful when interpreting overall prediction uncertainty.
Correlated error
Across states, errors in polls could be random, with some predicting Clinton doing better, and others predicting Clinton doing worse, than the actual outcome. When errors are not random but correlated between states, the direction of error will be similar between states. FiveThirtyEight described this issue as “If a candidate beats his polls to win Ohio, there’s a good chance he’ll also do so in Pennsylvania” [17]. Although it may seem obvious that some states’ polling might be “off” in the same way, how would this impact the final result?
When polls are correlated, the uncertainty for the final forecast will be greater than if the polls are assumed to be independent. Failing to account for this correlation when it is present can lead to overconfident predictions that underestimate uncertainty. For example, suppose we conducted polls in all 50 states and took the average to estimate that Clinton would receive 52 percent of the two party vote. How much uncertainty should we assign to that prediction? If we assume the polls across states are uncorrelated, we might estimate the range to be 50 – 54 percent. However, if we assume high correlation between the polls across states, the range could be wider, such as 45 – 59 percent. The figure below shows an example of how the uncertainty can increase with increasing correlation across polls.
Example uncertainty intervals for the share of the two-party vote, shown for increasing correlation in polls.
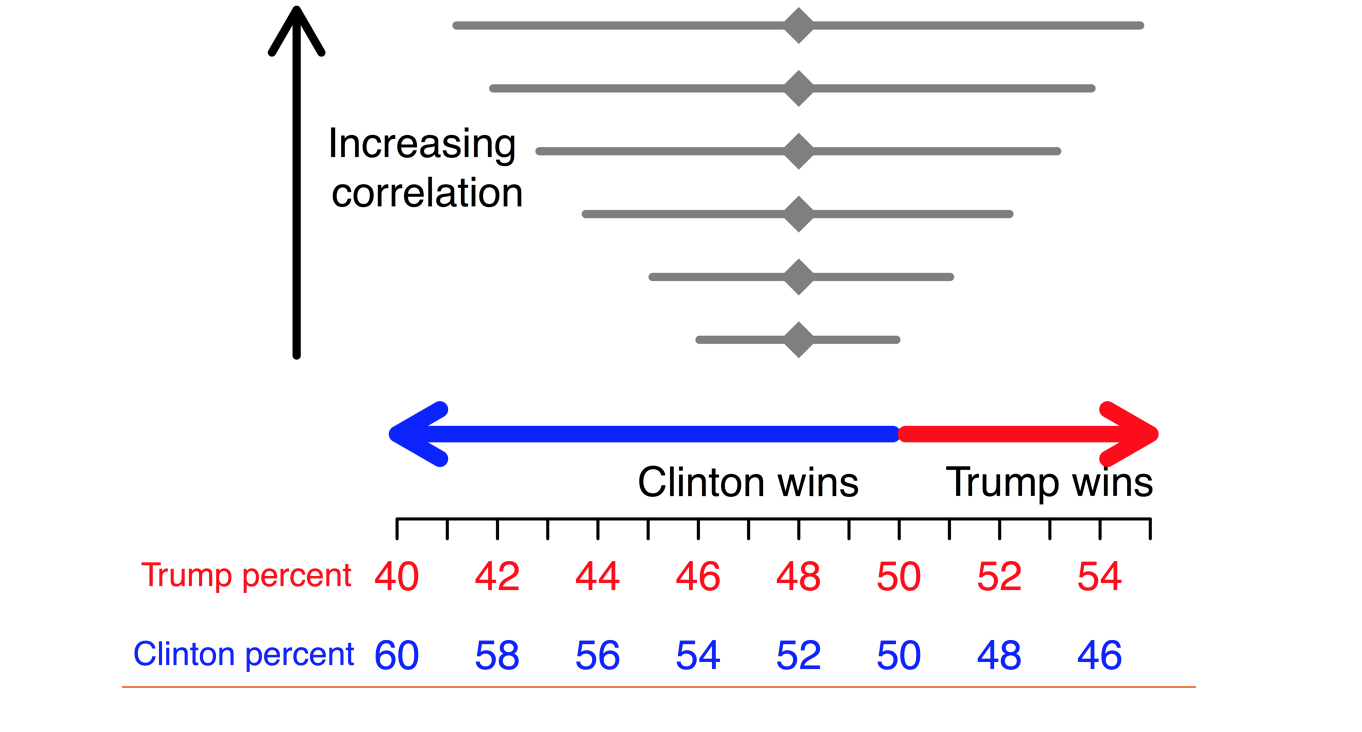
Correlation between polls is problematic because in the uncorrelated case a Clinton win would be very likely, but in the highly correlated case, the probability of a Clinton win would be much smaller.
Reporting on correlated error
There was substantially less mention of this issue relative to others following the election, though some articles did discuss its presence [18, 3]. The Washington Post stated that while the errors in polling were not far from previous elections, the systematic nature of the errors in this election made polling seem far more precise than it was in truth [3]. What was lacking from these and other articles was a detailed description of why correlated errors might result in forecasts missing the outcome.
Recommendations
Data aren’t dead, contrary to what some pundits stated post-election [2], rather the limitations of data are not always well reported. As Ozan Kuru at Mediashift said “Regardless of the reasons behind this prediction failure, the damage in public perceptions is already done and is grand.” [19]. To “undo” some of this damage will require a lot of work in improving communication of statistical ideas.
Before the election in November, a few notable pieces from the Huffington Post [16], the New York Times [20], and FiveThirtyEight [17] described in detail some of the issues we have mentioned here. A major challenge in evaluating polling and prediction models for these issues prior to the election is that many of the models are proprietary and their exact methodologies might be unknown. However, awareness of these potential quantitative pitfalls is important for promoting intelligent consumption of election forecasts in the future.
While pollsters will be reworking their models following the election, what can media journalists do to improve their overall coverage of statistical issues in the future? First, discuss possible statistical biases, such as errors in sampling and polling, and what impact these might have on the results. Second, always provide measures of uncertainty, and root these uncertainties in real-world examples. Providing tangible examples, like our earlier two-coin flip scenario, can help readers better relate to statistical ideas. And, finally, journalists interested in improving their reporting on statistical issues should ask for help from STATS.org’s advisory board of statisticians.
Dr. Jenna Krall is a biostatistician with research interests in air pollution and environmental epidemiology. She is an assistant professor at George Mason University.
Footnotes:
+Code for the first two figures can be found at bit.ly/krallelection
*Confidence intervals
*Confidence intervals and margins of error
One way to characterize uncertainty in a statistical estimate, such as a polling percentage, is through confidence intervals. A confidence interval is chosen so that a certain percentage of the time, for example 95%, the interval—a range of values for Clinton support—will include the true percentage. If a pollster sampled individuals in the same way 100 times, allowing for different individuals to be included in each sample, and created 100 confidence intervals, 95 of these intervals would include the true percentage of support for Clinton (i.e. the actual percentage of people who support Clinton among the whole population, rather than just within the sample). In polling, a margin of error is often reported as a measure of uncertainty instead of a confidence interval. The margin of error is the difference between the estimate and one confidence interval endpoint, such as the upper limit of the range of values. In our example of a prediction of 52% with an interval of 51%-53%, the margin of error would be +/- 1%, since 53% (the top end of the interval) is one more than the estimated 52%.
References
[1] http://projects.fivethirtyeight.com/2016-election-forecast/
[4] http://www.huffingtonpost.com/entry/pollster-forecast-donald-trump-wrong_us_5823e1e5e4b0e80b02ceca15
[6] http://www.huffingtonpost.com/the-conversation-us/reports-of-the-death-of-p_b_12898668.html
[7] http://blogs.wsj.com/cio/2016/11/09/bad-election-day-forecasts-deal-blow-to-data-science/
[8] http://www.foxnews.com/politics/2016/11/09/how-two-polls-predicted-trumps-surprise-victory.html
[9] http://www.latimes.com/politics/la-na-pol-trump-polls-20161109-story.htm
[10] http://fivethirtyeight.com/features/election-update-leave-the-la-times-poll-alone/
[12] http://elections.huffingtonpost.com/2016/forecast/president
[16] http://www.huffingtonpost.com/entry/poll-margin-of-error_us_57e1e985e4b08d73b82e4e33
[18] http://www.huffingtonpost.com/dr-john-johnson/how-the-polls-got-it-wron_b_12879594.html
The article shows very clear that statisticians don’t have answer. The problem with modeling the election is not mathematical (statistical) but behavioral. Saying behavioral I state the complexity of the problem. The way to solve the problem is a scientific research; research – as in natural science, & certainly with use of statistical tools. However, scientist with level of vision needed for this don’t work for public but for self-curiosity. In addition, who care to know before election, this is what election for – to elect.
Had a question. What is the probability of a ~180º flip in 12 hours of the Electoral College numbers? ‘Cause that’s what happened. How it happened or what actor might have pulled it off is the stuff of digital forensics, I suppose.