
Presidential Polling’s Margin for Error
Polls are finding Donald Trump ahead—way ahead—of other candidates running for the Republican nomination for presidency. Based on a recent Pew Research Center poll, CNN practically declared victory for him, noting he got 25 percent of the votes in the survey. The Daily News wrote off Jeb Bush—pointing to his 4 percent support rate. Ben Carson came in at 16 percent; Carly Fiorina and Marco Rubio won 8 percent.
Another poll conducted in October by MSNBC/Wall Street Journal/Marist, found Donald Trump has the support of 21 percent of the participating Republicans in New Hampshire– down from 28 percent of respondents in September. Fiorina comes in second, with 16 percent support, up from 6 percent a month ago. The same organization found 24 percent support for Trump in Iowa in October, down from 29 percent last month. Ben Carson, second in the lead in Iowa in this poll, captures 19 percent of the support, down from 22 percent last month.
Yet both polls had fewer than 500 participants, resulting in high margins of error (about 5 percent points). When taking the margin of error into consideration, the preferences of Republican voters are far from certain.
But first, what is a margin of error (MOE)? It doesn’t measure most kinds of errors that plague many polls and surveys, like biased questions or selecting survey respondents in a way that’s not random. MOE does not measure a mistake, either. When a random sample of all Republicans is taken—a small group of people meant to be chosen randomly from all the possible likely Republican voters—there is always a possibility that the opinions of those in this sample don’t reflect those of the whole population. The MOE is a measurement of how confident we can be that such a survey of the opinions of a small number of people actually reflects the opinions of the whole population.
Polls like these may have other major problems than simply sampling error. Quite possibly they haven’t accounted correctly for the demographics among the respondents to the polls. If those who respond are poorer, more likely to be white, less likely to be educated, or even less likely to vote, than those who actually vote, the survey will be biased. But assuming all of the issues of who participates in the poll have been adjusted, there’s still sampling error. That’s what the MOE addresses.
The MOE on the Pew and the NBC/WSJ/Marist polls have been largely neglected, leaving doubt about how much confidence we can have in Trump’s lead. The MOE on a poll with many possible responses is a little more complicated to interpret than a margin of error for a poll offering choices only between two candidates—so much so, it seems that media have avoided talking about its meaning entirely. At best, we’re seeing a nod to the margin of error with a statement of its numerical value.
Of the media sources mentioned, only CNN can be lauded for mentioning the size of the Pew survey and the corresponding MOE. But the interpretation? Left to the reader.
A 5 percent MOE in the national Pew poll means we can be 95 percent confident that Trump has somewhere between 20 and 30 percent support among all likely Republican voters (25 plus or minus 5 percent). In other words, if we were to conduct this survey many times with different samples of 497 randomly chosen Republican voters, 95 out of 100 times the proportion of the survey respondents supporting Trump, plus or minus the MOE, would contain the actual percentage of support in the whole American Republican population. We call the range of 20 to 30 percent support the 95 percent confidence interval for this poll.
![Picture: Gage Skidmore [CC BY-SA 3.0 (http://creativecommons.org/licenses/by-sa/3.0)], via Wikimedia Commons](http://www.senseaboutscienceusa.org/wp-content/uploads/2015/10/Ben_Carson_by_Gage_Skidmore_4.jpg)
Picture: Gage Skidmore [CC BY-SA 3.0 (http://creativecommons.org/licenses/by-sa/3.0)], via Wikimedia Commons
But there is a problem with this reasoning, and it stems from a poor statistical practice: We should not compare the two confidence intervals; rather, we should calculate a confidence interval for the difference of the two percentages in the survey—in this case 25-16= 9 percentage points difference between Trump and Carson. The fact that this difference of proportions is non-zero means that Trump is ahead in the survey (by 9 percent). How confident can we be that this difference is non-zero in the whole population?
Herein lies the problem. If each survey respondent merely said “pro-Trump” or “contra Trump,” we would answer one way. Suppose Trump was preferred by 54.5 percent of the polled individuals and the other 45.5 percent opposed him in a survey with a MOE of 5 percentage points. We can be 95 percent confident that Trump has somewhere between 49.5 and 59.5 percent support, while somewhere between 40.5 and 50.5 percent of people oppose him. We could not be 95 percent confident that Trump is getting 50 percent or more support. We could alternatively compute the difference in the proportions, which is 54.5-45.5 percent, or 9 percentage points. The margin of error for the difference is twice the margin of error for a single candidate, or 10 percent points. Since the computed difference is only 9 percent, but we do not have 95 percent confidence that pro-Trump is beating out “contra Trump.”
Yet this reasoning only works when there are only two candidates (and everyone is in favor or against). All the Republican polls are evaluating many candidates. In some sense, CNN’s listing a MOE is a distraction. When there are more than two candidates, the margins of error shrink. The formula for the margin of error for a difference in proportions is given by this more complicated formula:
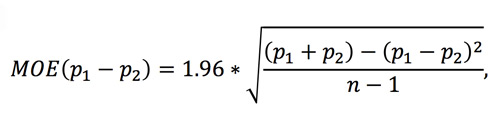
where p1 and p2 are the proportions of the two candidates and n is the number of people sampled. If p1 represents the support of Trump, and p2 represents the support for Carson, we have p1 = .25 and p2 = .16 in the Pew poll. Our formula then says that the margin of error for the difference of percent support is:
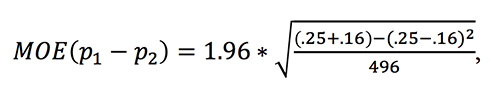
This comes to 5.6 percent. Since the actual percentage in the poll is 9 percent, we can be 95 percent confidence that the difference in support for the two candidates is 9 percent plus or minus 5.6 percent, or between 3.6 and 14.6 percent—which is above 0. In particular, we can be 95 percent confident that Trump is ahead of Carson. If we were to conduct 100 surveys like this one, in 95 of them we would expect the corresponding confidence interval to contain the true difference between the candidates. For this particular survey, that confidence interval contains only values showing Trump ahead of Carson.
We can similarly compare some of the less successful candidates in the Pew poll. Bush came in at just 4 percent. Rubio came in at 8 percent. By using p1=.04 and p2=.08, we arrive at a MOE for the difference of the proportions to be 3.0 percent. Since the difference in the poll was 4 percent, it is statistically significant that Rubio came in ahead of Bush, and unlikely to be reflection of simple randomness.
MSNBC reported these same Pew Research Center numbers with no mention at all of the margin of error—a lost opportunity, in our view, to point to the weakness of a small survey.
MSNBC also neglected to mention that the same problem plagues its own survey of likely voters in Iowa and New Hampshire conducted with the Wall Street Journal and Marist,. In the Iowa poll, Trump obtained 24 percent support and Carson came in at 19 percent, with 431 likely Republican voters surveyed. By using the same formula for the MOE for the difference, we obtain 6.2 percent, indicating that the two really are in a statistical dead-heat. In New Hampshire among the 450 likely voters who responded, 21 percent of respondents supported Trump and 16 percent supported Fiorina. The same formula leads to a MOE for the difference of 5.6 percent, more than the five percent difference in the preferences among those polled.
Yet Meet the Press led with the headline, “Trump Still Leads in IA and NH.” Well, this is true for the people who participated in the poll. We simply cannot be so confident that those polled reflect the whole population, even if they were sampled correctly.
A larger sample size would make a big difference in the poll, mathematically represented by the term “n-1” in the denominator of the formula. If you double the number n of respondents, you multiply the MOE by , or 0.71. We can see this effect by looking at margins of error given by the Quinnipiac University surveys of Republican primary candidates’ support in Florida, Ohio and Pennsylvania.
In Florida, Trump came in at 28 percent compared to the second choice candidate, Carson, who got 16 percent. Not only is the spread bigger between the candidates, but the MOE is smaller because Quinnipiac surveyed 1,173 Floridians to get their opinion, resulting in a MOE for the difference between Trump and Carson of 3.7 percent. Since the percentage difference is a full 12 percent, we can be 95 percent confident that Florida prefers Trump; in fact, a quick calculation shows that we can be 99 percent confident. In Ohio, 1,180 likely voters were surveyed, and 23 percent supported Trump, compared to 18 percent supporting Carson. Yet because the same size was so large, the difference is significant: the 95 percent confidence interval is 1.4 percent to 8.6 percent difference in support between the two candidates, in favor of Trump. It’s interesting to not that had Quinnipiac only sampled 450 people, and gotten the same result, we would not be confident of Trump’s lead in Ohio.
The margin of error only speaks to one kind of “error” in a poll, and that’s randomly picking people whose opinions happen not to reflect that of the whole population. There are a lot of other kinds of mistakes polls make. If, for example, Trump supporters are more eager to talk to pollsters than Carson supporters, the poll will indicate more support for Trump than actually exists in the whole population, and the MOE will not reflect that difference. But a careful interpretation of the MOE adds a little depth to an otherwise shallow stream of polling numbers.
Main image, Donald Trump by Andy Katz for iStockphoto.
Please note that this is a forum for statisticians and mathematicians to critically evaluate the design and statistical methods used in studies. The subjects (products, procedures, treatments, etc.) of the studies being evaluated are neither endorsed nor rejected by Sense About Science USA. We encourage readers to use these articles as a starting point to discuss better study design and statistical analysis. While we strive for factual accuracy in these posts, they should not be considered journalistic works, but rather pieces of academic writing.
Nice Article Rebecca! A couple of tiny errors: “If you double the number n of respondents, you multiply the MOE by , or 0.71.” => missing a fraction here. “Yet because the same size was so large” => sample. “It’s interesting to not that had” => note. I do have some additional follow-up questions:
1) You’ve indicated that a sample size of approximately 500 was small and a sample size of 1100 was much larger. As a layman, I don’t see any advantage to reporting a sample size value (e.g., ss=500) but only going by MOE – the lower the better. However, part of me is saying that I’m missing something important by doing that. Thoughts?
2) Are you aware of any way a poll can be audited to evaluate respondent selection and question bias? Or better – reach out to informed people for evaluation prior to polling? It would be nice if some independent measure could be reported showing these items were looked at by someone in the “know”. In some sense, the math reported in polls may be a disguise covering up bad methodology (like rich icing on a bad cake).
Thanks again!
Savvy discussion . I am thankful for the specifics – Does anyone know if I can obtain a template a form version to complete ?
Savvy discussion . I am thankful for the specifics – Does anyone know if I can obtain a template a form version to complete ?