
Design for democracy
Every journalist we talked to about the Bureau of Labor Statistics raved about the value of its data. But not one described their experience accessing that data as easy or pleasant
We asked a user-experience expert to investigate and recommend solutions
Trevor Butterworth
May 21, 2019
Photo credit: adapted from image by Rostislav Sedlacek for istockphoto.com
N
o business or service would be thrilled to hear that it took “intestinal fortitude” to discover and use its products—the phrase journalism educator Keith Herndon used to describe the experience of his students delving into the Bureau of Labor Statistics website (see article here).
But if your business is, quite literally, the business of the United States, and if understanding the business of the United States is essential to a rationally-functioning democracy, then how you communicate this knowledge is as much a critical part of the mission as collecting the data.
The irony is that the really hard work—the data collection—has been done and done well. And, it bears pointing out that the BLS is not alone in running out of bandwidth and resources to create dynamic ways of engaging and enlarging its audience: This is, unfortunately, a feature of many non-commercial research-driven projects and organizations.

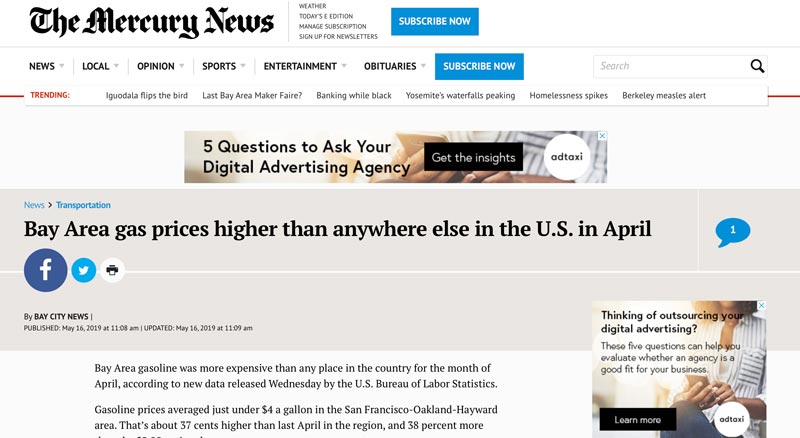
News stories using BLS data
It is with this in mind that we asked Ultan O’Broin, a user-experience product consultant with decades of experience in the technology sector, to look at the BLS.gov website, and to offer a critique and some recommendations.
His starting point was to take on the role of a journalist who needed data to create or support a story; and then his process involved interviewing subject matter experts—business journalists, columnists, and course administrators in higher education—before conducting an online survey designed to assess how they would go about their task.
We must stress that this is a mini-version of what would be involved in a full user-experience analysis.
Let’s start with the good
All the interviewees said that the BLS provided data that was timely, valuable, important, free, and impartial—but that it required dedication to manipulate (as in run data analyses) and communicate that data as valuable information.
User observations
The user experience is, initially, overwhelming; and yet, despite the amount of information on the BLS.gov home page, none of the user-experience review respondents could immediately see what they needed to do next. One very experienced columnist reported that they once resorted to calling the BLS team to help run a query.
The BLS data was seen as supporting or illustrating existing hypotheses and storylines originating elsewhere (from research, contacts, networking, other media). There were no “Aha!” moments of discovery. Perhaps as a consequence, there is a perception among some users that because the BLS is “obligated” to provide data, it has no interest in the subsequent consumption of the data.
The data was also not seen as suitable for news with shorter production timelines, and it can require weeks of work to be usable.
The site was also not seen as a compelling user experience for newcomers—or media students familiar with modern digital user experiences driven by the now-standard design expectations to drive adoption and maximize use. The lack of a contemporary look and feel and missing user-centric considerations reflect badly on the overall experience.
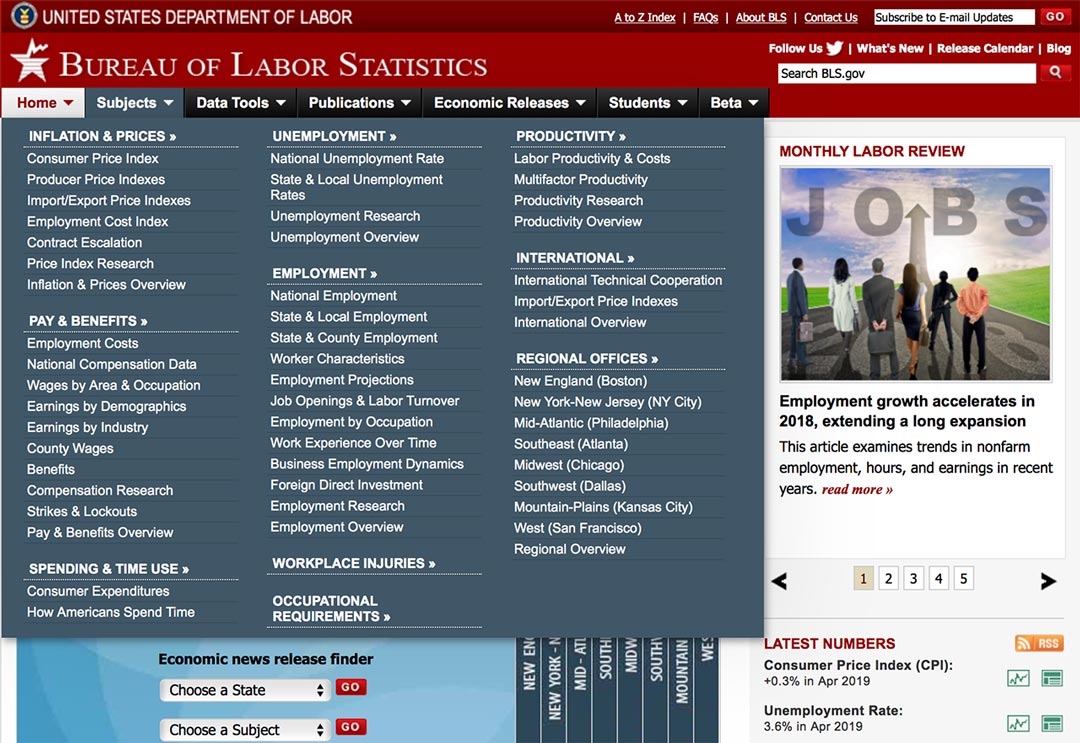
Homepage flyout menu showing complexity of content by subject.
A “consumer-hostile” design
While we are all adapting to better web design and usability, it’s important to remember that a generation of Americans have no memory of the cave-painting age of web design (the 1990s), and therefore have little appetite for web experiences that emulate the technical limitations of the past. By contemporary standards, the BLS website is “consumer hostile,” says O’Broin:
“[It’s] is a cluttered, data-driven experience, with a dated look and feel, reminiscent of the original MyYahoo or similar portals from the late 1990s. There is no obvious hierarchy or information architecture to navigate through. It is slow for expert users to complete a typical task; much scrolling and clicking is required generally; and important action buttons and key links are not immediate. The language used is old-school, IT department-centric, and domain-specific; it is not plain—a usability heuristic that is decades old.”
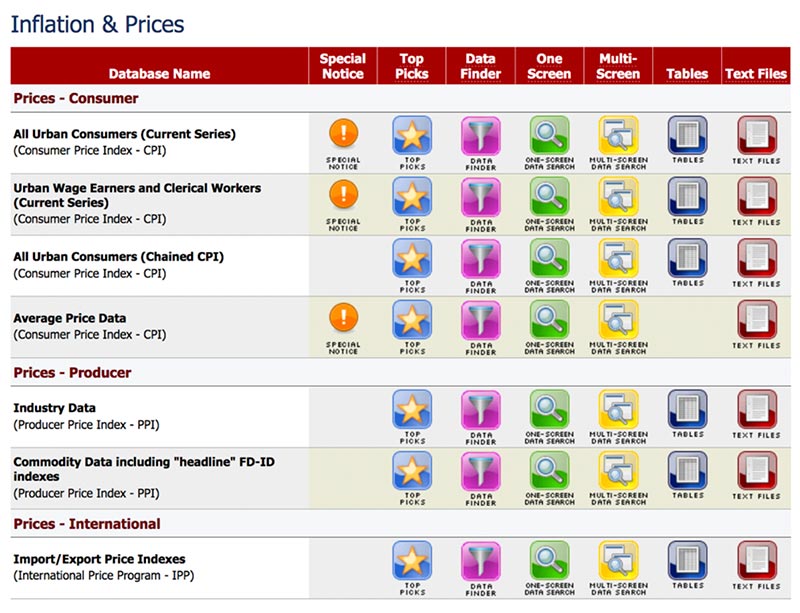
Data tools and options; usable—but with effort
“Some information is communicated in consumer-familiar ways (for example, trend charts), but the communications paradigm is fundamentally one of ‘raw data;’ it is not immediate or visual. The overall user experience is text and tabular driven, redolent of being designed by—and for—an internal IT team, without an understanding of user practices, or the participation of real consumers of the data.”
Fundamentally, he says, there is no answer to the reader question “what’s of interest to me here?” And there appears to be no mental model reflecting how a reader approaches the website.
Recommendations
-
Involve real users in the research of the design of the site and representative task-based testing in a working context. “It’s all about participation”, says O’Broin. “If you participate in the design, you’ll participate in the result. You’ll own it.”
-
Design a visual dashboard-style, analytics-driven, at-a-glance, “details-on-demand” approach to the “arrival” experience.
-
Simplify the experience. Provide an immediate answer to a reader’s question of “What’s going on here?” Or “do I need to explore more?” Or “how can I discover insight into X?”
-
Create and deliver content to match how website readers consume information: they focus initially on what’s immediate and then scan further, in an F-shaped pattern. Across the website important links and highlights now often appear “beneath the fold,” as the newspaper-scanning UX metaphor would put it.
-
Adopt a glanceable > discoverable > actionable information architecture, reflected in a redesign (Glanceable: An initial landing experience provides a quick take of what’s of interest. Discoverable: provides additional contextual detail [for example, grouping important information on info cards] for further exploration. Actionable: Easy navigation to task completion tools or a deeper-dive into the data, if needed).
-
Consumerize the search throughout, allow for further discovery, use search suggestions to speed up entry of search terms and questions users are familiar with from sites such as Amazon.com.
-
Use plain, consumer-like language and terminology for communicating content and interactions. Invest in an information designer (for example, to avoid surfacing backend IT terminology such as “wildcards,” “operators,” “Retrieve,” “Reset Form,” and so on. “When was the last time a journalist used a wildcard character such as * in a Google search?” says O’Broin.
-
Redesign the visual appearance (UI) of the website. Provide for consistency across pages and devices. Use familiar iconography, neutral, accessible colors, provide text and audio alternatives, and other languages such as Spanish.
-
Implement responsive web design approaches, standard for mobile work patterns across cloud computing. Although there is a smartphone version available, the site is not responsive. It is usable on laptops and tablets with effort.
-
At present there are small, unnoticeable “What’s New” and “Release Calendar” links on the home page header. Use notifications and alerts across the range of devices used in today’s working world to proactively inform readers of what’s new, interesting, and enable them to jump on the data. Timeliness of delivery is important.
-
Promote API integrations and customization of individual user experiences, reflecting how people actually work throughout the day.