
How to stand up for science: Young scientists take on “the food babe” by asking her to back up her claims with evidence
Stephanie Diamond

Matt Teegarden
Diane Schmitt

Jacob Farr

John Frelka

Want to change the world? Give kids data
Want to change the world?
Give kids data
Make it relevant to their lives—and give
them tools for visualization
Trevor Butterworth
Photo: izusek for istockphoto.com
We’ve shown, through access to large and relevant data sets that kids “can do things we thought were too hard for them.”
—Jim Ridgway, Professor, School of Education, Durham University
They were not the best and the brightest; they were not from elite schools or gifted programs; and to their teachers, they were not marked out for academic success. They were the muddle-alongs, the bored, the not good and never-likely-to-be-good at math.
And yet, within a matter of hours—and with no prior conceptual knowledge or study worth speaking of—these kids were interpreting data of the complexity normally associated with college programs. In some sessions, they were asked to assess media coverage of the same data, and the kids sometimes surpassed the reporters and editors in analytical sophistication.
Three hours. That was the length of the sessions developed by the researchers, James Nicholson, a former math teacher and chair of the International Statistical Literacy Project advisory board; Jim Ridgway, a Professor in the School of Education at Durham University, who had been leading a project to develop tests for math and science thinking that might identify children in socio-economically deprived areas as potential STEM students; and Sean McCusker, an engineering graduate, with a PhD in Civil Engineering, who had moved into educational research, and is now at Northumbria University.
If there was a downside,says Nicholson, it was that once the kids started to talk about what the data meant, the sudden enthusiasm for exploration led them towards over-interpretation.
When Nicholson was young, mathematics just made sense—so much so that he would acquire a degree in math from Cambridge University, teach at one of the most prestigious private schools in the United Kingdom, and then in a large academically selective school in Northern Ireland. But even here, in the U.S. equivalent of prep school, not being good at math was an open club.
Nicholson’s insight was that it might not be the kids’ fault: as he puts it, if you stepped back from the grind of teaching and thought about the way the textbooks and the curriculum explain concepts—and the way testing examines knowledge—the system wasn’t doing kids many favors in making sense of things. As Nicholson began to get involved in mathematical and statistical education, he became more convinced that kids were not being taught in a way that allowed them to engage with the reasoning behind the concepts.
“It was very procedural, very mathematical, with no particularly good articulation of why you were doing things,” he says. “Concepts like independence and probability were just stated without a lot of exploration as to what independence meant contextually. Everything was discussed as one variable or two variables with a straight line. That doesn’t describe a whole lot of the real world.”
It wasn’t just an excess of abstraction; when statistics referred to the real world, they did so in unreal ways. In one exam question, students were presented with data showing temperature changes as altitude increased, a well-known phenomenon understood by hikers and mountaineers. Unfortunately, the phenomenon was not well understood by the examiners, who created an implausible set of data for the test takers to analyze. Students who answered the question correctly would end up with a result that made no sense if they had ever hiked a mountain trail, a result that, if reflected upon, might prompt them to retrace their calculations, thinking them in error.
Other test questions followed a similar pattern: Calculate the mean from a frequency table but ignore the actual relationships between the ‘real world’ data and the real world—a children’s book in which all the words were four, five, or more letters. It takes a certain imagination to conceive of a book for children without conjunctions, definite or indefinite articles, and most of the prepositions we use to glue thoughts together into expression, and it takes a distinct lack of imagination to miss the bigger story being told through these kinds of surreal questions: The more you, as a student, regurgitated without thinking, the more likely you were to get the question right, and the more you were likely to think that statistics was an unworldly and largely useless practice. Stop and think logically and you risked confusion. Obviously, this style of teaching and examination presented few obstacles to those with an instinct and a liking for math; they accelerated past freezing hilltops and unreadable books into the mechanics of the concept, as their teachers and examiners did. But what of everyone else?
“I think context is extremely important,” says Nicholson. “The right examples can make a huge impact on how kids think about things—and more importantly what sticks.”
“The right examples can make a huge impact on how kids think about things—and more importantly what sticks.”
James Nicholson in his Belfast study.
Photo: Trevor Butterworth
Context was also a way of breaking into the analysis of multivariate data, which is to say, being able to work with more than two variables. In the real world, problems are almost always multivariate and often non-linear (the relationship between variables isn’t a simple straight line). Typically, this sort of analysis was the domain of university courses and ‘black box’ computer techniques. A student would feed their data into a program and then wait for it to spit out a regression (the relationship between the variables), which the student would then try and interpret.
The problem with this approach says Nicholson is that it didn’t allow you to visualize the relationships in the data. “If you could see the behavior, then the interactions are very obvious,” he says. “If you use the right sorts of context, they were accessible.”
In the background, several important developments were taking place: more and more data sets were becoming available, and more thought was going into tools for visualization and interpretation. In 2004, Nicholson, Ridgway, and McCusker began to go into schools armed with data and work with small groups of students to try and understand what was causing them problems. They kept iterating until they got the right mash up of data to unleash the kinds of questions that would get at the reasoning behind the concepts. They used data that directly spoke to the kids experience—drugs, educational attainment, sexually transmitted infections, smoking, obesity, poverty—with data on teen binge drinking offering the most engagement, not least because it was being treated in the media as a national scandal.
If you followed the headlines at the time, British adolescents were busily recreating Hogarth’s Gin Lane: teenagers had never been so boozed up, and the adult response—as channeled through the media—was that they urgently needed to be educated by their schools about why alcohol was bad for them, which would then—so the assumption went—lead them to moderate or stop.
The students were given data sets for their and previous generations’ alcohol use, along with evidence for the effects of lessons on alcohol consumption; and they were given an interface— comparative bar charts with sliders—so they could visualize the relationships between data. In some of the sessions they were asked to write news reports or opinion pieces that contrasted their findings with those in the real press.
They used data that directly spoke to the kids experience—drugs, educational attainment, sexually transmitted infections, smoking, obesity, poverty—with data on teen binge drinking offering the most engagement…
The Interface
The challenge of communicating complex information is that it is either oversimplified or it ends up retaining most of its complexity, says McCusker. The first path leads to misunderstanding, the second, to not understanding at all.
“We need,” he says, “to look at the idea of evidence and its dissemination as one construct.” This is where his engineering background comes into play, literally. “What people need is to play with the data, to get a feel for it.”
The interface to the alcohol data set made it transparent, “so that the kids immediately engage with the messages within the data rather than with the complexity,” he says. The kids aren’t even aware that they’re doing something they don’t normally do, which is to interact with multivariate data.
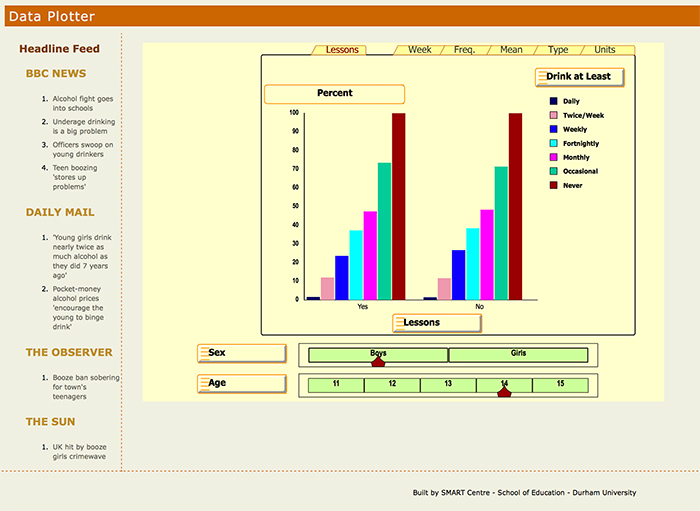
Click on the image to go to the plotter. Once there, drag and drop variable names to alter the display and the tabs across the top take you to different alcohol related data sets.
McCusker remembers one girl who appeared to find the whole exercise tedious—“it was just another lesson on not drinking”—and so he sat down and helped to work through the interface.
“Do your teachers tell you not to drink,” he asked, do they tell you it’s a bad thing to drink?”
“Yeah,” she replied.
“Does it do any good?”
“No.”
“Do you think your teachers think it does any good?”
“No.”
“If your teachers think it is pointless and you think it is pointless, why are you still doing this?”
At which point, he says, she sat up and started looking at the data to see if it really was pointless. “From this, she saw that those criticizing her generation for drinking too much actually drank the same [amount] when they were her age.”
“The data,” he says, “empowered her to say, ‘yes, I know these are pointless as lessons because, basically, you do what your friends do, and here’s some evidence.’ It’s a powerful thing for people to have a voice in their own lives. They can use data to make decisions over right and wrong contextualized to their behavior. Are they more at risk, as portrayed by the media, or are things as they have always been?”
This sense of empowerment was general—even for 13 and 14-year-olds around the 75th to the 80th percentile of the academic spectrum, says Nicholson. “They weren’t using sophisticated language like ‘interactions,’ but they were quite clearly identifying changes in behavior—and critically for us, they were quite comfortable doing that.” Technology, the interface, had unlocked their “natural” statistical reasoning; they were using big statistical concepts—interactions and effect sizes—without realizing it.
There were several reasons for this.
First, the exercise didn’t start with a closed, direct question that demanded the binary thinking of “I must find the right answer to this.” For kids whose normal experience of math was that of mostly getting things wrong, says Nicholson, this was psychologically freeing. “They were much more open to having a go at interpretation.”
Second, they connected with the data. “Their friends are part of the data,” says Nicholson, “they are part of the data. They know the older kids drink more than the younger kids, so they have something matching their experience, and therefore they have a language to talk about the data. Not having a language to talk about data is, I think, a big obstacle.”
We’ve shown, through access to large and relevant data sets that kids “can do things we thought were too hard for them,” says Ridgway via email. “Children need to see that there is a point in investing effort in learning things—and/or that it is fun. Content needs to be relevant to them—or they can see it is relevant to someone. A problem with math classrooms has always been the triumph of technique over meaning and usefulness. Interactive displays let kids see real stuff.”
The implications for educational inequities are not lost on the researchers, both in terms of getting people to ‘see’ that such inequities exist, and then to start doing something about them. In this, good interactive displays also give overburdened teachers a chance to improve their skills in posing questions.
Inexorably, this leads to the role of data and reasoning from evidence in sustaining democracy. The more kids (and citizens) have access to data through interactive displays, “the more they will be empowered to think about how the world is organized and should be organized,” says Ridgway. “A disadvantaged underclass, where people don’t value knowledge, is a threat to democracy.”
McCusker, who also uses Lego to get people to build physical models of ideas in order to extract how people see problems, is even more expansive: We have to think of statistical literacy as a democratizing skill that must be open to everyone, and not just experts. “If you want to understand complex social phenomena,” he says, “there is a small group of people who decide how they are analyzed and presented, and what is valid. I’d like to see recognition that new conventions are acceptable and to open up the scope of data interpretation to a much wider population. Then we can argue what it all means and what’s right and what’s not right.”
The more kids (and citizens) have access to data through interactive displays, “the more they will be empowered to think about how the world is organized and should be organized”
—Jim Ridgway, Professor, School of Education, Durham University
Communicating Plant Biology
Communicating Plant Biology
This is a guest post from Eric Hamilton
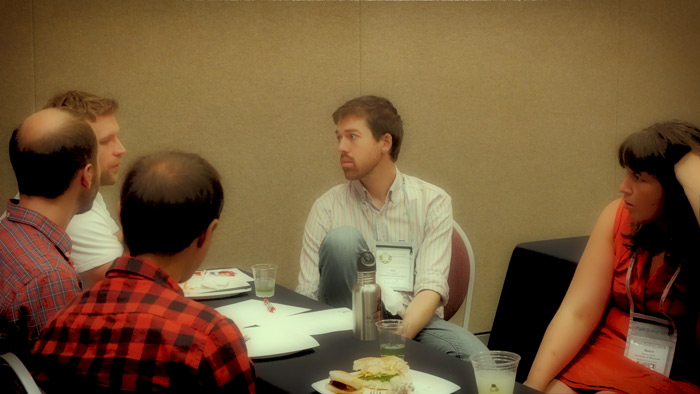
After four long days at a conference, all you want to do is board a flight home, crawl into bed, and try to forget how your boss saw you dancing at the open-bar party. But on July 30, 2015, a dedicated group of scientists and communicators rallied at the end of Plant Biology 2015 conference in Minneapolis, MN, for the Standing Up for Science Media Workshop on science and the public engagement hosted by Sense About Science USA.
As the 2015 ASPB-sponsored AAAS Mass Media Fellow, I was invited to participate in the workshop and talk about why and how I began pursuing opportunities in science communication. And I eagerly joined my colleagues in discussing ways early-career scientists can improve how science weaves its way into the media.
The media workshop was divided into three sessions, with a corresponding panel of scientists, journalists, and scientist-communicators.
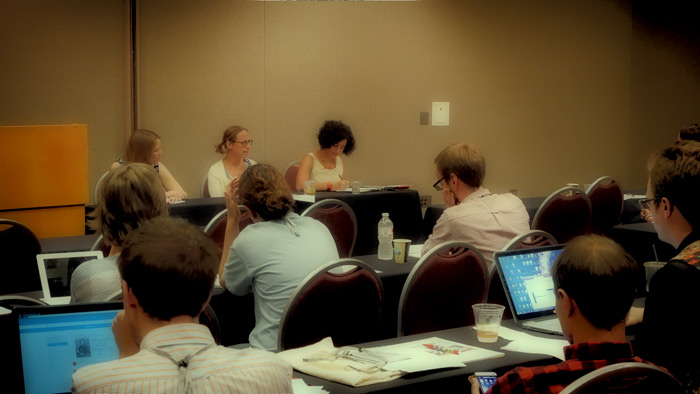
Participants take part in group work discussing what the media gets right and wrong.
To start, Douglas Cook, a professor at University of California, Davis, made it clear that scientists should be firm about combatting myths and speaking forcefully for evidence-based action. “Science is not democracy,” he said, no matter what the polls say. For effective communication, facts and data are insufficient—people find their own version of the truth. Instead, Cook suggested, look for the values people hold, and see if your work can fulfill those values.
Coming at the issue of how to engage with the public from a different perspective, Sally Mackenzie, a professor at the University of Nebraska-Lincoln and president-elect of ASPB, felt that a coordinated, repeated message could break through even to opponents of some scientific advance, such as genetically modified (GM) foods. “Some level of activism is our responsibility,” she said, dispensing with the notion that scientists should remain disinterested observers from their labs.
During the question and discussion period of the session, we discussed the labor force of science communication: should it be advanced by scientists who add on communication, or by dedicated communicators with scientific training? Do you need a Ph.D., or is a Bachelor’s degree sufficient? Do you need to study science at all?
The issue we kept coming back to is whose responsibility is communicating science? In academia, science communication is usually left as an extracurricular activity for overworked professors. That will never compete with efforts made by organizations that are committed to advocacy that goes against science and evidence. For instance, as someone noted Greenpeace—a vocal opponent of GM foods—spends $185 million a year on communication alone [The figure was closer to $211 million in 2013].
And with that, it was time for lunch and group work on what the media gets right and wrong when covering science, which led to the second session for the day. In the journalist panel we heard from Emily Sohn, a freelancer and contributor to the Science Writer’s Handbook, and Elizabeth Dunbar of Minnesota Public Radio.
Journalists Elizabeth Dunbar and Emily Sohn (left to right) tell the audience how they work and how scientists can better engage with the media to ensure that science is correctly communicated.
To a room filled mostly with scientists, Sohn described how she finds stories, and how scientists can help her get their research to the public. If you are responsive to emails and phone calls from journalists and give clear, concise answers to questions, you might just end up as one of her “Super Sources” – someone she returns to time and again. And though Cook and Mackenzie, as well as several other scientists in the audience, felt that they had “been burned” by sloppy journalism, Sohn tried to make clear that she was on their team: “We’re all trying to get it right,” she said.
Dunbar, who had stumbled into science journalism from a general assignment background, freely admitted that in radio—where four minutes is a lifetime—she has learned that to communicate effectively she needs to cut all but the most basic scientific concepts. “I try to teach my audience something about science,” she said, and then explain just a fraction of the hot new research.
At the end of the panel discussion, the audience was given a chance to pitch their own work to the journalists to see how well they could capture attention for a possible story. In one instance, Sohn and Dunbar helped Don Gibson, a Ph.D. student at the University of California, Davis, to plan his pitch to journalists on his campaign to put Barbara McClintock on the ten-dollar bill. Their advice: Give a positive message, and make the main point—it’s time to put a female scientist on currency—pop out right away.

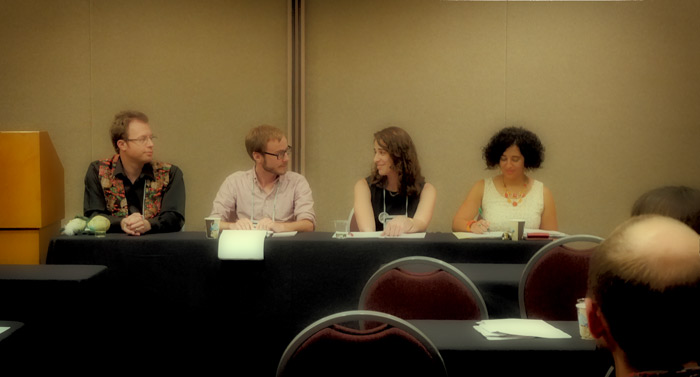
The final panel of the day discuss different resources and opportunities for science students to get involved in science communication. From left to right: Karl Haro von Mogel, Eric Hamilton, Natalie Henkhaus, and Neda Afsarmanesh.
And then it was finally time for the last panel, where, I joined Karl Haro von Mogel of Biology Fortified; Natalie Henkaus of the Boyce Thompson Institute (which supported the workshop) and soon-to-be ASPB staff member; and Neda Afsarmanesh, Deputy Directory of SAS USA and the organizer of the Media Workshop. We all had scientific backgrounds and we were all in the process of or had already moved into full-time science communication positions.
Henkaus stressed the importance of collaborative communication efforts from the NSF’s Research Coordination Networks, ASPB’s National Plant Science Council, and Cornell’s Alliance for Science (another supporter of the day’s workshop). Von Hogel described how Biology Fortified began as a group blog and morphed into a forceful advocate for biotechnology—and purveyor of cute GMOs. And I got to tell what it’s like to jump straight from the lab into the newsroom, and the importance of funding for training in communication. As the final panel, we had the luxury of longer, casual conversations that conveniently morphed into hor d’oeuvres and drinks. Business cards were exchanged; dramatic reenactments of speeches were staged; theories of science communication were pored over and debated.
My takeaway from the day: Journalists and scientists have a lot in common. They both want to tell others about what they see in the world—what they know to be true—and they both want everyone to be as excited about the story they have to tell as they are.
Eric Hamilton is a Ph.D. candidate in Plant Biology at Washington University in St. Louis, where his research in the lab of Elizabeth Haswell focuses on mechanosensation and pollen’s response to stress. He has given a number of presentations in the St. Louis area on plant science, genetic engineering, and crop domestication, working closely with the community gardening organization Gateway Greening, and is an advocate for improving the communication of science to diverse audiences. Eric currently works as the ASPB-sponsored AAAS Mass Media Fellow at the Milwaukee Journal Sentinel, covering science for the regional newspaper during this 10-week program. You can find his work at hamiltonerics.com and follow him on Twitter, @hamiltonerics.

Asking the Food Babe for Evidence
In late January, a group of students pursuing graduate degrees in food science published an open letter to Vani Hari, aka The Food Babe, an Internet activist who has amassed a huge following by attacking what she perceives as threats to people’s health from the foods they eat. Hari is not a scientist. Not everyone has to be a scientist to have a legitimate opinion about the role of science in society, but what scientists (and many citizen scientists) do know is that if you are going to make scientific claims, especially claims that are often frightening, you should make sure that you get the science right; moreover, you should be prepared to provide evidence for your claims and to answer your critics, whether they are scientists or not. The only way that will happen is if those interested in evidence “stand up for science.” This is what Sense About Science USA is all about: Asking for evidence and standing up for science. So, we asked the students—all but one pursuing PhDs in food science—to talk about why wrote their letter, what they thought about Hari’s response, and for their thoughts on the way food is covered in the media. They responded jointly.
SAS USA: What was the motivation and the process behind your letter to Hari?
It is rather frustrating for us, as students of food science, to see misinformation about food get so much attention. We were motivated to reach out to Ms. Hari because the public deserves balanced, non-sensationalized information on the science of food. It became impossible for us to sit and watch her attack our profession, especially since it is clear she does not really know what it is all about.
When writing the letter, we did not want to belittle Hari because her work echoes concerns about food that consumers legitimately have. We want to try and help change the tone of the food dialogue from one that encourages fear to one that strives for understanding.
What struck you about her response?
We are very pleased that Ms. Hari read our letter and chose to respond. It is unfortunate that she did not allow for comments on her response, as this contradicts the open dialogue we are trying to start. While her response lacked a scientific foundation, it has opened the doors for others to join the conversation.
Your letter could be read as a criticism of the news media for not doing a great job of holding up Hari’s claims to scrutiny, or for not delving deeply enough into the science of food science. Thoughts?
Our letter was definitely not intended as a criticism of the news media. We simply wanted to advocate for good scientific communication. It is important that new discoveries are made public, but they need to be viewed as a snapshot in time, meaning we need to look at each study in the context of the greater body of research that is already in existence. One study is not the be all, end all.
Your letter could also read as a recognition that food science has done a woeful job of explaining itself to the public. Thoughts?
In short, yes. The landscape of the food dialogue is incredibly complex because there are so many different people contributing to it: chefs, foodies, health enthusiasts, and the like. Unfortunately, the number of scientists joining in the conversation has been proportionally low, and it is time for that to change.
Our food system is not static; it changes constantly as scientific knowledge is advanced. Additionally, the public’s interest in food will forever follow trends making it hard for anyone to see the bigger picture. These aspects of food present a unique challenge to scientific communication. Joining in the conversation is likely unappealing to many researchers for this reason, but that truly is a problem. The public is asking valid questions, yet they are mostly receiving answers from individuals who disregard the scientific process.
In light of the media often failing to ask for evidence on behalf of its audience, do you see a growing opportunity and need for scientists, especially grad students and early career scientists, to stand up for science by engaging in journalistic communication?
There is definitely a need for scientists at all points in their career to effectively engage with the public. People see value in science when it is communicated effectively. It is interesting how some media outlets forgo actual food experts for individuals like the Food Babe when commentary is needed. This sentiment has been touched on by some recent blog posts on Science Meets Food. We have noticed growing interest among our peers to participate in scientific outreach, and we hope that it comes to fruition.
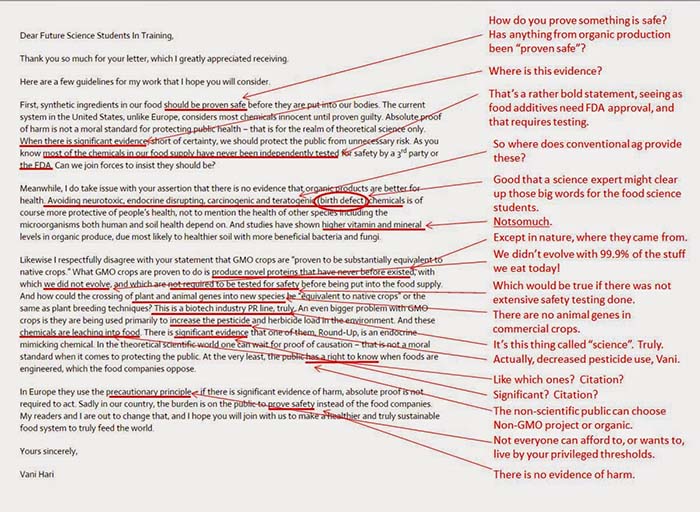
The Food Babe responded to the students, but with assertion not evidence. Kevin Folta, Professor and Chairman of the University of Florida’s Horticultural Sciences Department, redlined what’s wrong and missing. Typically, the Food Babe avoids responding to her critics.
Would you say that young scientists like yourselves have a different attitude to science communication than older generations?
There are some established food scientists that are especially keen on science communication. It is our hope that this number continues to increase as the next generation of scientists begin their careers. We have grown up in an era where we are saturated with social media making it extremely easy to have a far-reaching voice, so it is hard to say whether we have a different attitude towards science communication or just more effective channels for it. The fear of putting one’s credibility on the line, especially as a graduate student or new professional, will likely persist, but hopefully more scientists will become open to engaging with the public as new ways to do so emerge.
Finally, what would you say to a non-scientist when they see claims like those made by Hari?
Take it with a grain of salt. Hari, and those like her, get no benefit from presenting a balanced argument. Many of them are just trying to sell books. Since the science of food involves multiple disciplines, we encourage people to research all sides of an argument and seek out credible sources of information to better inform their own choices.