
Can a Half-Cent Tax on Drink Save Lives?

A recent study appears to confirm a long-held conviction about alcohol abuse and driving while under the influence: If you increase the price of alcohol, you will end up saving lives. The twist to the latest peer-reviewed research, which appeared in the American Journal of Public Health, is that the benefit exacts a trivial cost to the consumer: a nickel a drink may be the difference between life and death; in fact, it might only be half a cent.
If it seems that this study has a rosier-than-possible bouquet, trust your instinct: the data presented say otherwise. According to the authors, an excise tax in Illinois in 2009—which effectively increased the price of a glass of beer by less than half a cent, a glass of wine by half a cent, and a drink with spirits by almost five cents—has resulted in a decrease in traffic deaths by 26 percent. Indeed, according to these authors, a nickel a quaff can keep drunk drivers off the road.
Unsurprisingly, the study, by Alexander Wagenaar and his co-authors, made news: HealthDay News and U.S. News and World Report claimed, “Higher Alcohol Taxes May Lead to Fewer Drunk-Driving Deaths: Study,” though their story tactfully included the caveat that the study “wasn’t designed to prove a cause-and-effect relationship;” Medical Daily claimed “Drunk-Driving Deaths Drop In Illinois After Implementing Higher Alcohol Tax,” but with no such disclaimers regarding causality, and while incorrectly reporting the increased tax rates by a factor of ten (The tax increase on beer on wine amount to less than half a cent per serving while Medical Daily claimed it was 4 cents and 4.8 cents for wine and beer, respectively). The Washington Post declared, “Our booze is too cheap and it’s literally killing us.”
Almost 35,000 Americans die each year from car crashes and pedestrian and bike accidents involving cars (the number has gone down over the past few years and is now, to closer to 30,000). Of these accidents, some 35-37 percent involve alcohol; a 26 percent reduction in alcohol-related car accidents could save thousands of lives. The tidy notion that taxing the drinkers will reduce risky behaviors (while costing non-drinkers absolutely nothing) certainly has curb appeal; the data, however, simply don’t support the theory.
The scene of the crime
Wagenaar et al. argue that the number of fatal car crashes in Illinois has been decreasing, but that there is a bigger drop in deaths due to alcohol soon after the excise tax was instituted in 2009. Models using regression show that the 26 percent drop is statistically significant and is sustained over time.
While the authors admit that the Great Recession of 2008 may explain part of this decline, they insist that the drop is still at least 15 percent and statistically significant. And they insist that they are measuring a consequence of the excise tax, rather than data trends that occur over longer periods of time.
To bolster the argument that the excise tax is the reason behind the drop in deaths in late 2009, they compare the data to similar data in nearby Wisconsin, where there was no excise tax. The study does not disclose its analysis of the comparison to Wisconsin, but they claim that there was no comparable drop in deaths during that period.
Let’s start with a simple sanity check. Does the bird’s eye view match the conclusions drawn from the authors’ complicated analysis? Here is the monthly data (in blue diamonds) on the number of automobile accidental deaths in Illinois from September 1999—ten years prior to the excise tax—to December 2013.
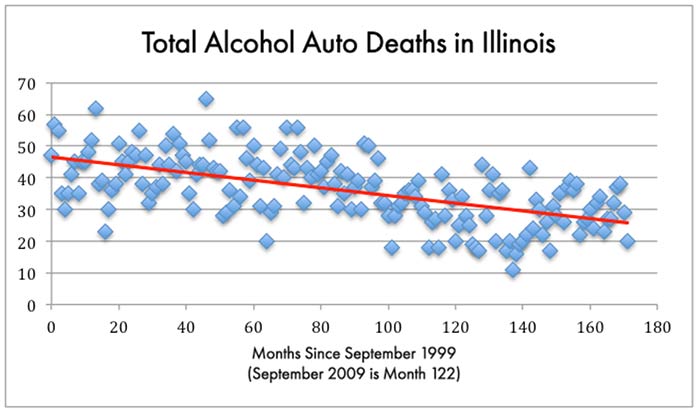
The red line is a simple linear model of the data that indicates the best fit if we assume the number of deaths decreases by approximately the same amount for each month that passes.
Perhaps this overall trend, which seems to have hardly anything special at all going on at the end of 2009, reflects our taking too high a bird’s eye view. Perhaps we have considered too many years; indeed, the authors of the study preferred to look at the data from 2001 to 2011 only, which results in this picture:
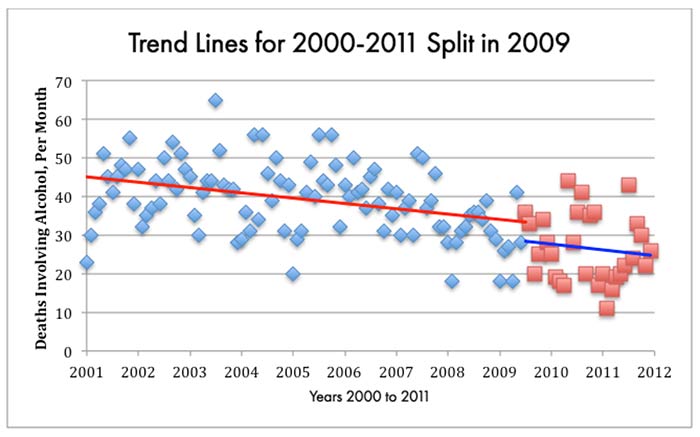
The blue data points indicate deaths per month before September 2009, and the red data points indicate the deaths following that month. They are each fitted with lines that provide the best linear prediction of the trend. It looks as if there was a drop in deaths in September 2009 from a predicted 33 deaths per month (given by the tail end of the red line) to a lower predicted value of only 28 deaths per month at the beginning of the blue line. Sure enough, that’s a drop of about 15 percent. The march toward fewer deaths continues. Importantly, according to Wagenaar et al., the drop is greater starting at the beginning of 2009.
Why only 15 percent when the authors tout a drop in 26 percent? Perhaps Wagenaar is reluctant to acknowledge the very point he made in the article: a reviewer complained that they hadn’t adequately taken into consideration changes that were already in play earlier than the imposition of the excise tax, particularly the Great Recession in 2008. After accounting for that drop in disposable income, the remaining decrease associated to the alcohol tax is 15 percent, according to Wagenaar’s analysis.
So we now consider the possibility that there was a 15 percent drop in fatalities due to the excise tax.
Convincing results should be resilient to changes in choices, such as whether to use data published 2011-2013. The authors excluded this data even though it seems to have been available to them. If this data is added a slightly different story begins to emerge using a similar analysis. This is how the data look when, once again, they are split into “before September 2009” and “after September 2009:”
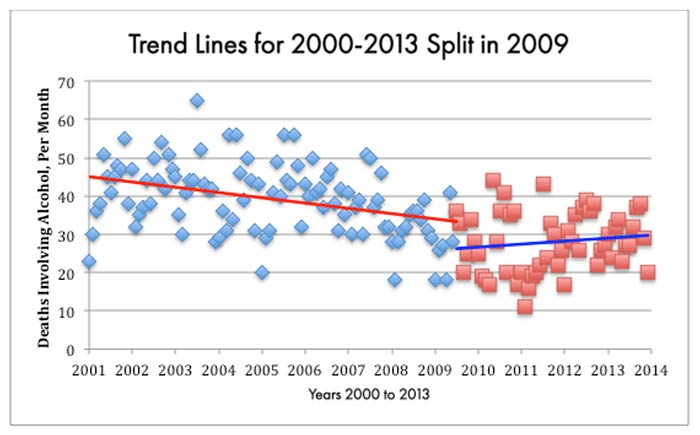
It looks like the excise tax “resulted in” a drop in deaths, but that it also “resulted in” a new trend of increasing deaths since that time until 2013, which is the latest time for which we have the data.
Alcohol Deaths as a Proportion of Deaths
For sure, vehicular deaths due to alcohol went down over the years; but, in fact, they were also going down for accidents not involving alcohol. While it may be tempting to see the trends above as a huge victory for anti drinking-and-driving advocates, we might also consider the decrease in the context of all road deaths. As a proportion of total deaths due to car crashes, here’s what those involving alcohol look like:
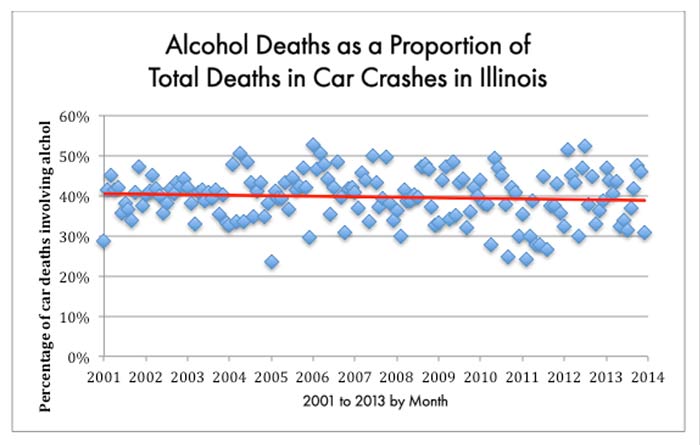
Sure enough, it looks like there’s a decreasing trend: over more than 10 years, the proportion of deaths from alcohol went from just over 40 percent to just under 40 percent, though it turns out the decrease is not statistically significant. If considered a victory, it is a small reduction of deadly car crashes involving alcohol, as a proportion of all car-related deaths in Illinois. There is little to suggest a huge drop in alcohol-related deaths independent of overall death rates by cars. Pretty much everyone is less likely to die on the roads, with little suggestion that drinkers are presently a smaller proportion than they used to be of those involved in accidents.
But the story isn’t quite as neat and tidy if we look at what happened starting in September 2009, when the excise tax was introduced:
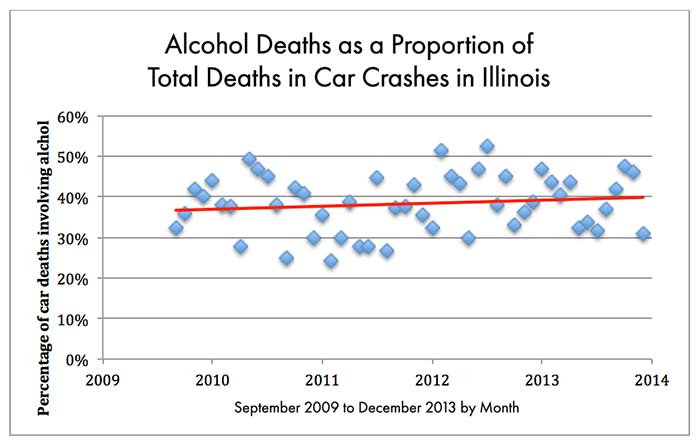
The best linear fit suggests an upward trend from about 38 percent of the crashes to about 40 percent by the end of 2013 (though as before, it’s not statistically significant)‹
Of course, the real story here is that breaking the data at year 2009 may not be an appropriate way of measuring the trends, and certainly it’s not appropriate to “blame” the excise tax for the proportionally increased alcohol deaths in the context of decreasing deaths associated to alcohol. But by the same logic neither is it appropriate to conclude that the excise tax has been saving lives.
Linear (and logistic) regression cannot speak to causality
That old bugaboo, causation does not equal correlation, may sound trite or dismissive, but it’s an essential part of understanding how a study can lead us astray and, in this case, detract from the very serious problem of driving under the influence. There is little reason to believe that an excise tax is causing the decrease in alcohol-related vehicular deaths. Trends occur for many reasons, and the decrease in alcohol-related deaths has been a long-standing trend, dating back over ten years. In particular, if we look at monthly alcohol-related deaths in the entire United States, we find a steep and encouraging trend downward. In September 1999, for example, Illinois experienced almost 50 deaths per month related to drinking and driving; by September of 2013, there were closer to 29 deaths per month.
The crux of the problem for Wagenaar and his group is that they are looking at data that has quite a lot of variability, and trying to tease out the influence from one factor. But even if you have a continuous factor—say the tax rate went up every month by a small amount and we saw these downward trends—we could not point to the tax as the reason behind these decreases. Regression analyses only point to correlations, such as saying that these tax increases occurred as the rates were going down.
The idea of regression is that you assume dependence on a variable (in this case, the year/month in which we took the data) and then we measure what these data predict for other years. This dependence is an assumption, not a conclusion; in fact, it would be a little strange to take the clear downward trend in deaths involving accidents and conclude that “later years are causing a decrease in deaths.” There must be other forces at work, such as cultural shifts away from drinking and driving, the possibility of reduced alcohol consumption overall, educational efforts to get people off the road, safer roads, safer cars, etc. Perhaps an excise tax is part of the mix of factors driving the downward trend; however, an analysis such as this can only show at best that an excise tax correlates with a decreased death rate rather than causes the decrease.
Media accounts, instead, have imitated the language of the article itself, and made causal conclusions.
Contradictory inclusion/exclusion of cost data
The main argument of the authors is that cost increases have resulted in reduced consumption (and therefore, that drivers are less likely to be under the influence). The authors note that the tax rates, which are a fixed dollar amount per gallon of alcoholic beverage, have eroded over time. At the same time, incomes have gone up, so that as a proportion of income the cost of alcohol is a small fraction of what it used to be. According to the authors, price sensitivity lies behind the decreased driving deaths; the increased tax results in reduced consumption.
Yet, if price sensitivity leads to increased drunk driving deaths, then why do we see an ongoing and consistent decrease in death rates in the context of decreasing prices overall? The authors claim that increasing prices (due to taxes) can lead to reduced deaths, while the data show that decreasing prices lead to… reduced deaths. To state the obvious, it’s unlikely that decreasing prices “lead to” reduced deaths rather than simply correlating with them. The issue here is that causal claims in the context of this kind of analysis are misguided.
Another unreasonable decision by Wagenaar is to include data only through 2011. The data through 2013 shows a much richer story, with a small dip in death rates at the end of 2009 and early 2010 that seems, in context, like a reflection of the variability of the data (how monthly deaths vary month to month). If one wanted to attribute the small dip to the excise tax, then one should also note the subsequent increase (or return to the earlier trend) and conclude that the excise tax had a minor and short-term impact, perhaps reflecting people’s acclimation to the penny more they are paying for two beers, and returning to their normal patterns.
Driving under the influence of alcohol is a serious and, sadly, somewhat intractable problem. The trend is positive but seems to reflect an overall downward trend in deaths rather than one associated specifically with drinking. The notion that we can make a significant impact on the problem with minor price increases is tempting, but in this case, the statistical data doesn’t add up.

Please note that this is a forum for statisticians and mathematicians to critically evaluate the design and statistical methods used in studies. The subjects (products, procedures, treatments, etc.) of the studies being evaluated are neither endorsed nor rejected by Sense About Science USA. We encourage readers to use these articles as a starting point to discuss better study design and statistical analysis. While we strive for factual accuracy in these posts, they should not be considered journalistic works, but rather pieces of academic writing.
Hi,
There used to be a great article (about Odds Ratio vs. Risk Ratio) by Rebecca Goldin up on this site (http://www.stats.org/stories/2008/odds_ratios_april4_2008.html)
Any idea where it went?
Thank you!
Mark