
Can statistics save us from gerrymandering?

The Supreme Court is weighing the question of whether voting districts can be drawn in ways that give an advantage to one party, thereby violating the principle of one person, one vote. In Harris v Arizona Independent Redistricting Commission, a group of Republican voters argue that the districting commission redrew the boundaries in 2011 such that, as the Tucson Sentinel put it, “almost all of Arizona’s Republican-leaning districts are overpopulated, and almost all of the state’s Democratic-leaning districts are underpopulated.”
The US constitution requires every state to reevaluate the boundaries of voting districts after each national census, taken every ten years, and to redraw those boundaries to take into account changes in population. But did Arizona’s redrawing amount to gerrymandering—the deliberate manipulation of voting district boundaries to give Democrats an advantage? Or was the commission simply trying to comply with the Voting Rights Act amendments requiring that districts should be drawn so as to maximize minority voters?
The impact of partisan gerrymandering can be significant, leading to a majority-vote party in a state (Democrats) obtaining minority status in the legislature in both North Carolina and Pennsylvania in 2012. Only the state of Florida presently outlaws partisan gerrymandering, which means that the Supreme Court’s decision could have far reaching political impact. But can statistics provide a non-partisan way to figure out how much imbalance constitutes a problem?
Yes it can, said Sam Wang, a professor of neuroscience at Princeton, in a recent opinion piece for the New York Times. The problem, as Wang points out, is that “Partisan redistricters stuff voters of the opposing party into a smaller number of districts, while spreading their own voters over a larger number of districts to eke out as many bare wins as possible.” This is the argument before the court in Harris, where conservative voters in Arizona claim they have been overstuffed into fewer districts and therefore have less political voice than they should.
Certainly, statistical descriptions and criteria about districting can add some objectivity to the process—but only if we carefully lay out what these statistics mean, and what they do not. Though statistics can guide us, there is a decidedly human element to statistical decision-making.
Slicing and dicing: two ways to gerrymander
We start with looking at how gerrymandering can win an election in a two-party system. There are essentially two ways in which redistricting can obtain a win for one party when a majority of the voters cast their support for the other.
The first relates to the margin by which parties win in each county. Suppose there are 1290 Democratic voters and 1210 Republican voters in a state. If these Democrats mostly live in two specific districts with relatively few Republicans, and the rest of the Republicans are spread over three different districts with a scant majority in each, one could obtain a Republican win in a Democratic state. This can happen even if the number of people living in each district is the same. In the chart below, Republicans win three out of five districts while Democrats constitute a majority of the population, and each District has an equal number of people.
Example 1

Each of Districts A and B have Democratic wins by large margins, whereas the Republican wins are by smaller margins in more districts.
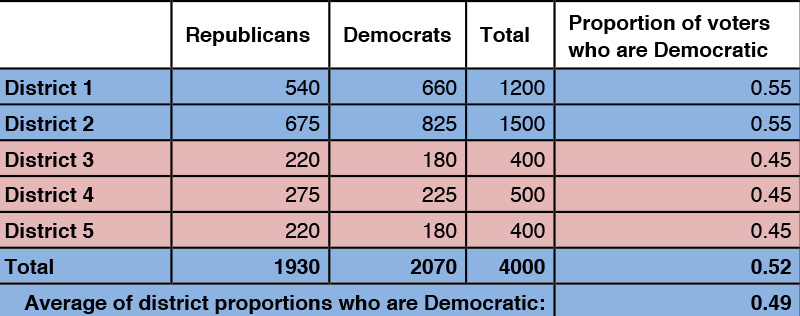
On the other hand, there might be no real differences in the percentages of support among the various districts, but some districts are much bigger than others. A majority vote in a big district may count more if each district counts equally. In the case below, every win is obtained with 55 percent of the majority voting party. Yet again, Democrats win fewer districts than Republicans while Republicans have only 48 percent of the total vote.
Example 2
Is it really unfair?
Of course, the number of people in each district (assuming each district counts equally) is not going to be exactly the same, and neither are the percentages of support for the winning party. So what variation of voting patterns among districts might clue us in to the possibility of gerrymandering?
Wang’s op-ed notes that one could use basic mathematics to evaluate political fairness. The idea is to use the difference between a median and a mean. If the difference between the two is too great, then the districting should be considered overly partisan.
The median of a list of numbers is the “middle number.” If Democratic support across five districts in a state were given in increasing order by the percentages 44, 46, 48, 56, and 64 as in example one above, then the median district would be the one whose Democratic support is the middle value, at 48 percent. The mean, or average, is 51.6 percent.
In example two, Democratic support is given in the five districts by 45, 45, 45, 55, and 55 percent; their median value is 45, and their mean, or average, is 49 percent.
If districts have different population sizes, the mean of the proportions of support across districts will not equal the actual support for Democrats. In example two, the actual Democratic support is just under 52 percent (given by 2070/4000), while the mean of the proportions across districts is 49 percent. We will use the mean of the proportions as our point of reference. When districts have equal populations, these two numbers are equal.
Wang suggests that by comparing the median level of support with the mean level of support we will be able to assess the possibility of gerrymandering: In both our examples, we see that the median support for Democrats is less than the mean support, and the districting does not allow the Democrats to win, despite majority support.
When the median and mean differ, we say that the data are skewed. For example, the mean U.S. income is higher than the median income because very high earners push the average up. Yet it doesn’t matter how much Bill Gates earns in terms of where I stand on the income scale as he is only one person. The median is more relevant to describing the data when it comes to “the average person,” since the median tells us the point at which half the population earn more, and half the population earn less.
How skewed is too skewed?
In a typical data set, even one “sampled” from a symmetric distribution, such as the well-known bell-curve (or normal distribution), the mean and the median are different. How do we decide if the data are unreasonably skewed? This is where statistical analysis can play a powerful role: Wang advocates that we use measures of skewness to obtain a “zone of chance.” The zone of chance is a computed range of values for the median around the mean that we generally would expect to see under some assumptions. If the median is farther from the mean than these calculated values, it’s outside the zone of chance.
The zone of chance is by its nature probabilistic. Is observing a difference between the median and the mean (such as the one in example one—3.1 percentage points) extremely unlikely assuming the data were generated through a random process? How unlikely should something be before it is excluded from the zone of chance? If the tolerance for unlikely events is high, the zone of chance will be large; if we only want to consider relatively likely events to be in the zone of chance, then the zone will be a narrow window around the mean.
All these statistical constructs do rely on assumptions: one may need to assume that the data are drawn from a normal curve, centered at 50 percent, for example. One may need to assume that the percentages of support in each district are themselves independent of one another. Or one may need to assume that there are enough districts to validate these statistical tests. These assumptions lie behind the calculations of how probable it is to see data as skewed as we see it. Changing the assumptions changes the probabilities.
Wang has come up with a neat statistical trigger warning for gerrymandering, but it is not objective: we still have to make judgment calls: data points just outside the zone of chance are unlikely, but not impossible, to occur, assuming that the process is a random one.
In other words, statistical tests identifying the probable difference between the mean and the median cannot tell us if gerrymandering occurred—or even the likelihood that gerrymandering occurred. They indicate the likelihood of this outcome (or a more extreme outcome) occurring, assuming it did occur by chance. How small a likelihood that something would occur, assuming it did occur by chance, may influence an opinion about gerrymandering, but that threshold is ultimately a human—not a statistical—decision.
Wang’s proposal would bring statistics into a field fraught with politics, and could perhaps help to eliminate extreme tinkering. At the very least, statistics can measure the discrepancies and quantify their likelihood of “occurring under chance-like” conditions, without its calculations evolving simply into partisan tools. Even if a mean-median difference is unlikely to occur, however, gerrymandering may not be behind the imbalance. And even if a difference occurs with relative frequency, extreme partisan gerrymandering may be at play; one can create a bias in favor of one political party, while holding the mean and median very close. Statistics can provide information, but people need to interpret their value in the context of other possible evidence for, or against, unfair gerrymandering.
Better to use seats-votes curve asymmetry. (Total displacement from symmetry). That’s a much more comprehensive, stable, accurate, etc. statistic than mean v median, or really any other statistic. But you actually need 3 metrics: one for partisan asymmetry, one for racial vote packing, and one for total competitiveness (the sum of the margins of victory in each election).
Better to use seats-votes curve asymmetry. (Total displacement from symmetry). That’s a much more comprehensive, stable, accurate, etc. statistic than mean v median, or really any other statistic. But you actually need 3 metrics: one for partisan asymmetry, one for racial vote packing, and one for total competitiveness (the sum of the margins of victory in each election).
Bottom line is that the only thing to save us from gerrymandering is to allow voters to determine their representation in a bottoms-up way, not try to find a “fair” way of having representation determined by the top-down through how lines are drawn. To achieve this objective, we need to pass laws to: 1) have mult-winner districts, with larger districts with more than one representative — something that has long been part of our traditions in the U.S.; 2) empower voters to elect representatives in proportion to their voting strength, as done in a growing number of cities in the U.S.;) have these multi-winner districts drawn based on criteria that prioritizes traditional standards, tempered by the values of upholding the Voting Rights Act and preventing one-part domination of any district.
All this can be done by statute. See more on this proposal at FairVote’s RCVAct.com
Good article. However the 2nd chart needs to be fixed as it currently shows up as a duplicate of the first.