
Should You Hold Your Breath to Reduce Pain?

Original photo © Robert Ingelhart
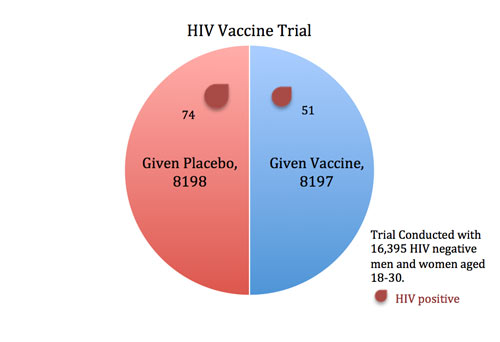
In 2009, an HIV vaccine trial made headlines (e.g., For First Time, AIDS Vaccine Shows Some Success) because the study showed some potentially promising results. When researchers gave an experimental vaccine to 8197 volunteers and a placebo injection to 8198 others, fewer participants in the vaccine group contracted HIV than in the placebo group (51 versus 74).
But what do these results mean? And how do we know this isn’t merely reflecting chance variation? Clearly, if 60 infections had occurred in the vaccine group versus 65 in the placebo group, we might chalk this minor difference up to chance. Similarly, if only 5 infections had struck the vaccine group versus 120 in the placebo group, this would be a landmark moment in the history of medicine—because it would be evident that the vaccine worked.
But with an imbalance of 51 to 74, we can’t simply rely on intuition to draw conclusions. We need formal statistical tests to help differentiate between real effects and chance fluctuations.
P-Values and Statistical Significance
To formally compare the proportion of infections in the vaccine group to the placebo group, we use a “difference in proportions” test. We start by assuming that the vaccine doesn’t work (this assumption is called the “null hypothesis”). This means we assume that we are only seeing random fluctuations and ask how likely we are to see this difference in results between the two groups. If the vaccine is worthless, then the trial’s results are analogous to flipping a coin 125 times and coming out with 51 heads and 74 tails (notice there are a total of 125 cases of HIV in the two groups combined). How probable or improbable is this?
It turns out that when you flip a coin 125 times, you will get between 52 and 73 heads 95 percent of the time. The probability of getting outside of this range (including getting 51 heads) is just five percent (also written as .05).
In other words, if the vaccine were completely ineffective, we would expect to see a 51-to-74 imbalance (or an even bigger imbalance) in the two groups about five percent of the time. This five percent is what we call a p-value.
Five percent is just small enough to make us suspect that our initial assumption—that the vaccine doesn’t work—might be wrong. In fact, researchers typically deem results with p-values less than five percent as “statistically significant,” meaning that they are improbable enough to warrant further attention.
P-values are frequently misunderstood, and the HIV vaccine trial was no exception. The p-value *is* a probability: if you *assume* that the vaccine does absolutely nothing and only chance directs the occurrence of deaths, the p-value is the probability we would see 51 deaths in one group and 74 in another, or more extreme differences.
Since the p-value assumes the vaccine doesn’t work, it is *not* the probability that the vaccine doesn’t work (using additional data, one analysis estimated this probability at 22 percent, not 5 percent). The p-value also gives us no information about the quality of the study or any potential biases that may have affected the results. But p-values *can* help us to recognize when apparent patterns could just be chance fluctuations. If an
outcome is merely a reflection of chance, the p-value tells you the likelihood of seeing data like yours. If the p-value is small, we generally conclude that the events were not occurring randomly.
Big Differences that Aren’t Significant
The bigger the difference between the groups, the more likely the result is to be statistically significant. But two other factors also influence p-values: the sample size (or number of events, such as infections) and the variability of the outcome. Large differences between groups may not be statistically significant if the sample size is small or the variability is high, whereas small differences may be statistically significant if the sample size is large or the variability is low.
Take a recent study in the Journal of the American College of Cardiology that made headlines for suggesting that strenuous exercise may actually be bad for your health (e.g., Training very hard ‘as bad as no exercise at all’). The authors reported that the mortality rate in “strenuous” joggers was three times higher than that of moderate joggers and nine times higher than that of light joggers—a seemingly startling trend.
But these differences turn out to be statistically indistinguishable. Why? The strenuous jogger group was too small to make reliable conclusions—there were just 36 people in this group, only 2 of whom died.
When the numbers are so small, a single death can make a huge difference, so we cannot be very confident that the mortality rate of all joggers is necessarily reflected by the mortality rate of joggers in our small sample.
Small Differences that Are Significant
Sometimes small differences are statistically significant, but not clinically significant. Take a recent study in Pain Medicine. Researchers reported that holding your breath may reduce acute pain, such as from an injection. In this study, 38 volunteers rated their pain on a 0-10 scale as researchers mechanically squeezed their fingernails. Each volunteer repeated the experiment under two conditions: while holding their breath and while breathing slowly.
Each person’s pain estimation while holding breath is compared to his or her own estimate while breathing slowly. Whereas different people may fluctuate widely in how painful they find nail squeezing, the same person is likely to perceive the pain similarly on different occasions. Thus, by using people as their own controls, this study design reduced the variability in pain scores. This reduced variability makes it easier to detect small effects.
On average, volunteers found the nail squeezing less painful by 0.2 to 0.5 points when they held their breaths compared with when they inhaled slowly. Though this difference is small, it was highly statistically significant (p=.0006, which is far below the level .05 typically used for statistical significance).
The small p-value suggests that the observed reduction in pain isn’t just a fluke. But the more important question here is: Is it a big enough reduction to care about?
Will it be useful for pain management when the reduction is so small? Clearly a comparison between groups has to include not only an evaluation of how likely we are to see the data, if they are just occurring through random processes, but also an estimation of the real-world value of any observed differences.
What to look out for when reading about research comparing two groups
- Are the appropriate groups being compared? For example, in a randomized trial, the key comparison is between the treatment group and the control group.
- Is the difference between the groups statistically significant? Be wary of studies that find a “trend toward” significance but do not reach it. A low but not very low p-value such a p=0.10 does not mean “it’s more likely than not” to be that a difference was observed. It means that, if only chance is at play, you have a 10 percent chance of seeing such data or more extreme.
- Is the difference between the groups big enough to care about? For example, if it’s a medical study, are there clinical implications?
- Are the authors justified in making any causal claims for the differences between the two groups? If the study is observational, it’s extremely difficult to determine causality, even though many scientific authors use language implying a causal relationship.
Please note that this is a forum for statisticians and mathematicians to critically evaluate the design and statistical methods used in studies. The subjects (products, procedures, treatments, etc.) of the studies being evaluated are neither endorsed nor rejected by Sense About Science USA. We encourage readers to use these articles as a starting point to discuss better study design and statistical analysis. While we strive for factual accuracy in these posts, they should not be considered journalistic works, but rather pieces of academic writing.
THANK YOU! I am so tired of people being afraid of flying and sharks, and not cars…